Best-Practice-Recruitment-Dashboards auf Knopfdruck
Die Gewinnformel für Ihr Unternehmen liegt nicht in Spreadsheets begraben. Sie liegt in der vorgefertigten Analysefunktion von Vincere.
Keine Spreadsheets.Keine IT erforderlich
Zugriff auf eine Bibliothek von Best-Practice-Dashboards, darunter mehr als 50 vorgefertigte Berichte.
Management leicht gemacht
Decken Sie die Stärken und Schwächen jedes Beraters auf, damit Sie konstruktive Gespräche führen können, um ihnen zu helfen, sich zu verbessern.
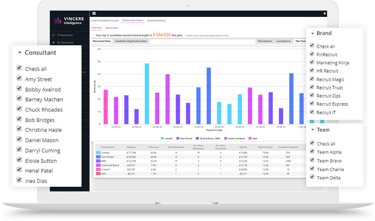
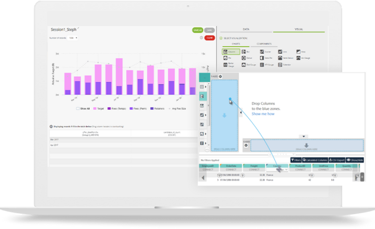
Slice-and-Dice in Echtzeit
Wenden Sie Filter an, um schnell zu sehen, was Sie sehen möchten. Drilldown nach Marken, Niederlassungen, Teams und einzelnen Beratern.
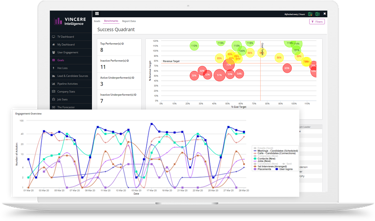
Eine 360°-Ansicht über Ihr gesamtes Unternehmen, in Echtzeit
Von Business Development, Performance Tracking, Pipeline-Aktivitäten bis hin zu Umsatz und Prognosen - Vincere Intelligence liefert Ihnen innerhalb von Sekunden alle Antworten, die Sie brauchen.
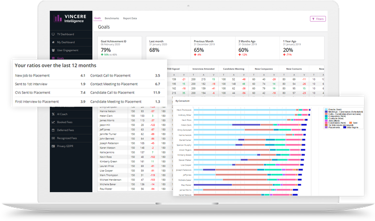
Ziele/KPIs erfassen
Sie können Ziele festlegen und die Leistung Ihres Teams im Auge behalten, indem Sie sich die in der Plattform erfassten Aktivitäten ansehen.
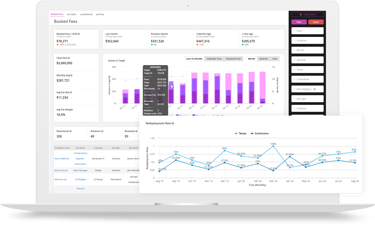
Umsatzwachstum verfolgen
Genau wissen, wie viel Geld eingeht. Zu jeder Zeit.
Werbeausgaben im Auge behalten
Stellenbörsen sind teuer. Finden Sie heraus, welche Quellen die besten Kandidaten und den besten ROI einbringen.
Demo vereinbaren
Sehen Sie sich Ihren Aufwand nach Unternehmen an und sehen Sie, wie viele Aufträge sie Ihnen erteilt haben.
Gamification
Erfolge feiern, indem sie Echtzeit-Statistiken und Ranglisten auf einem Leaderboard anzeigen.
Verbesserung der allgemeinen Datenqualität
Überlassen Sie Vincere die Polizeiarbeit mit Berichten, die Ihnen helfen, sich von "Müll" zu befreien.
CRM / ATS Nutzung maximieren
Der Mensch ist ein Gewohnheitstier. Stellen Sie sicher, dass Vincere zur neuen Gewohnheit wird - wenn es nicht in Vincere ist, ist es nicht geschehen.
Audit-fähige Compliance-Dashboards
Alle Ihre DSGVO-Aktivitäten werden auf einem Dashboard erfasst und visualisiert.
Suchen Sie nach benutzerdefinierten Berichten?
Das Self-Service-Analysemodul von Vincere gibt Ihnen die Superkräfte, die Sie benötigen, um beliebige Berichte zu erstellen.
![]()
“Es gibt keinen Platz zum Verstecken. Man erhält eine ausgezeichnete Sichtbarkeit bis hinunter auf die Beraterebene, und das können wir, weil die Dashboards und Leaderboards so gut funktionieren.”

Robert Quirk
Head of Marketing bei Tempting Ventures
Sind Sie bereit, Ihr neues
Recruitment OS kennenzulernen?
Recruitment Begriffe
1. Was ist ein Recruiting-Dashboard?
Ein Recruiting- oder Talent-Dashboard ist ein Instrument, das interaktive Visualisierungen Ihrer Recruiting-Daten bietet. Mit einem solchen Dashboard können Nutzer schnell einen Überblick über den Prozess erhalten, Trends erkennen und Verbesserungspotenziale identifizieren.
Recruiting-Dashboards werden in der Regel verwendet, um die Anzahl der erhaltenen Bewerbungen, die Anzahl der durchgeführten Bewerbergespräche und die Anzahl der erteilten Angebote zu verfolgen. Darüber hinaus unterstützen sie auch bei der Überwachung des allgemeinen Fortschritts nach Abteilungen und Jobfunktionen.
Dank der Möglichkeit, alle relevanten Aktivitäten an einem einzigen Ort zu visualisieren, sind diese Dashboards äußerst vorteilhaft für Personalvermittlungsagenturen, die ihren Recruiting-Prozess und ihren Erfolg optimieren möchten.
2. Wieso brauchen Personalvermittlungsagenturen Dashboards?
Dashboards sind für Personalvermittlungsagenturen aus verschiedenen Gründen ein entscheidendes Werkzeug.
Erstens bieten sie eine einfache Möglichkeit, potenzielle Recruiting-Probleme zu erkennen. Dank der Erfassung von Datenpunkten lässt sich leichter erkennen, wo Engpässe und Ineffizienzen auftreten. Sobald dies erkannt ist, können Agenturen die notwendigen Änderungen oder Verbesserungen vornehmen.
Darüber hinaus ermöglichen sie Personalberatungsagenturen, bessere datenbasierte Entscheidungen zu treffen. Dadurch können sie ihre Ressourcen effizienter und effektiver einsetzen und fundierte Entscheidungen darüber treffen, welche potenziellen Kandidatinnen verfolgt werden sollen.
Diese Dashboards sind auch nützlich, um die Leistung des Teams zu verwalten, da sie eine visuelle Grundlage bieten, um zu beurteilen, ob das Recruiting-Team seine Leistungskennzahlen (KPIs) erreicht.
Schließlich können Personalvermittlungsagenturen durch die Analyse von Recruiting-Funnels raffinierte Strategien entwickeln, um kontinuierlich ihre Chancen auf erfolgreiche Vermittlungen zu verbessern.
3. Was zeichnet gute Recruiting Dashboards aus?
Recruiting-Dashboards sind ein leistungsstarkes Werkzeug zur Datenvisualisierung und Geschäftsanalyse für Personalvermittler. Dennoch ist die Gestaltung eines effektiven Dashboards nicht einfach eine Frage des zufälligen Zusammenfügens von Diagrammen und Grafiken. Um wirklich nützlich zu sein, sollten einige bewährte Verfahren befolgt werden:
- Wählen Sie Daten selektiv aus
Die auf dem Dashboard enthaltenen Daten sollten sorgfältig ausgewählt werden, um den Benutzern die nützlichsten und relevantesten Informationen zur Verfügung zu stellen. Zu viele Daten können überwältigend sein, während zu wenige wichtige Erkenntnisse übersehen lassen könnten. - Verwenden Sie Diagramme und Grafiken
Diagramme und Grafiken sollten gezielt eingesetzt werden, um Daten auf eine leicht verständliche Weise zu visualisieren. Die Navigation sollte einfach sein, damit Benutzer schnell die benötigten Informationen finden können. - Aktualisieren Sie kontinuierlich
Schließlich sollten die Daten regelmäßig aktualisiert werden, um sicherzustellen, dass das Dashboard immer ein genaues Bild der aktuellen Situation liefert.
4. Wie erstellt man ein Dashboard?
Ein Analyse-Dashboard für das Recruiting ist ein leistungsstarkes Tool, das dazu beitragen kann, den Rekrutierungsprozess zu optimieren und wertvolle Einblicke in den täglichen Betrieb zu gewinnen. Aber wie baut man ein Dashboard, das wirklich funktioniert?
Der erste Schritt besteht darin, die Arten von Dashboards festzulegen, die Sie benötigen. Möchten Sie einen einfachen Überblick über Ihren Rekrutierungsfortschritt oder etwas mit detaillierteren Informationen? Möchten Sie die Anzahl der eingegangenen Bewerbungen, die Anzahl der durchgeführten Vorstellungsgespräche oder die Anzahl der ausgestellten Angebote verfolgen?
Sobald Sie sich für die Arten von Daten entschieden haben, die Sie verfolgen möchten, ist es an der Zeit, die relevanten Kennzahlen zu identifizieren. Wenn Sie beispielsweise die Anzahl der eingegangenen Bewerbungen verfolgen, möchten Sie Dinge wie Antwort- und Konversionsraten betrachten. Wenn Sie die Anzahl der durchgeführten Vorstellungsgespräche verfolgen, möchten Sie Dinge wie das Verhältnis von Vorstellungsgespräch zu Angebot und die Zeit bis zur Vermittlung betrachten.
Anschließend ist es an der Zeit, alle Ihre Datenquellen an einem Ort zu integrieren. Dieser Schritt ist sehr wichtig, da er es den Personalvermittlern ermöglicht, ihren Fortschritt im Laufe der Zeit zu verfolgen und Trends zu erkennen, die ihnen sonst entgehen könnten.
Schließlich können Sie nun Ihr Analyse-Dashboard für das Recruiting in Excel/Google Sheets erstellen oder es mithilfe einer Software für Personalvermittlungsagenturen aufbauen.
5. Welche Dashboards gibt es für Recruiting?
In Bezug auf Recruitment-Dashboards gibt es vier Haupttypen: strategisch, operativ, analytisch und taktisch:
- Strategisches Dashboard
Ein strategisches Dashboard konzentriert sich auf das große Ganze. Es verfolgt KPIs wie Time-to-Hire (Zeit bis zur Einstellung) und Cost-per-Hire (Kosten pro Einstellung), die der oberen Geschäftsleitung dabei helfen, Entscheidungen über die Ausrichtung der Rekrutierungsfunktion zu treffen. - Operatives Dashboard
Ein operatives Dashboard konzentriert sich auf den täglichen Betrieb des Recruiting Teams. Es enthält Kennzahlen wie die Anzahl Vakanzen und die Anzahl der Bewerbungen pro Stelle. Basierend auf diesen Daten können Personalvermittler ihren Fortschritt verfolgen und Engpässe im Prozess identifizieren. - Analytisches Dashboard
Ein analytisches Dashboard konzentriert sich auf die Datenanalyse mit Kennzahlen wie Konversionsraten und Quelle der Bewerbung. Diese Informationen ermöglichen es Personalberatern zu verstehen, wo Kandidaten herkommen und wie effektiv der aktuelle Prozess ist. - Taktisches Dashboard
Ein taktisches Dashboard konzentriert sich auf kurzfristige Ziele, die mit Kennzahlen wie offenen Stellen und laufenden Anfragen visualisiert werden. Basierend darauf können Personalvermittler ihre Arbeit priorisieren und sicherstellen, dass alle Vakanzen zeitnah besetzt werden.
6. Schlüsselmetriken für Recruiting-Dashboards
Eines der wichtigsten Aspekte eines jeden Rekrutierungsprozesses ist die Fähigkeit, wichtige Kennzahlen zu verfolgen und zu messen. Dadurch können Unternehmen erkennen, was gut funktioniert und was nicht.
Einige der wichtigsten Kennzahlen, die in Ihrem Rekrutierungsmetriken-Dashboard verfolgt werden sollten, sind:
- Bewerbungen pro Vakanz: Die Anzahl der Bewerbungen, die für eine Stelle eingehen, geteilt durch die Anzahl der offenen Stellen.
- Annahmequote von Angeboten: Der Prozentsatz der Kandidaten, die ein Angebot annehmen.
- Rekrutierungserfahrung: Wie zufrieden Kandidaten mit ihrer gesamten Rekrutierungserfahrung sind.
- Zeit bis zur Vermittlung: Die Zeit, die benötigt wird, um eine offene Stelle zu besetzen.
- Qualität der Einstellung: Diese Kennzahl misst den Wert und die Qualität der Einstellungen.
- Kosten pro Vermittlung: Die Gesamtkosten für die Vermittlung eines Kandidaten.
- Fluktuationsrate: Der Prozentsatz der Kandidaten, die während eines bestimmten Zeitraums das Unternehmen verlassen.
7. Recruiting-Software oder Excel/Google Sheet
Recruiting Dashboards bieten speziell auf die Verwaltung von Rekrutierungsdaten zugeschnittene Funktionen und Tools. Dadurch wird es einfacher, prozessbezogene Informationen zu verfolgen und zu analysieren.
Im Gegensatz dazu handelt es sich bei Excel und Google Sheets um allgemeine Tools, die für generische Zwecke entwickelt wurden. Obwohl sie als Art von Dashboard verwendet werden können, verfügen sie nicht über Funktionen, die sie so effektiv machen wie dedizierte Software.
Ein weiterer Vorteil der Verwendung von Software besteht darin, dass sie in der Regel einfacher zu bedienen ist. Dies liegt daran, dass die Benutzeroberfläche mit den Benutzern im Hinterkopf gestaltet ist und die Software regelmäßig aktualisiert wird.