リクルートメントの
「ベストプラクティス」

Vincereに搭載されている分析ツールが勝利の方程式を描き出す。

お問合せ
Intelligence Rebuilt Recruitment Dashboard 1
Intelligence Rebuilt Recruitment Dashboard 2

スプレッドシートも
IT知識も不要

50を超えるベストプラクティスが詰まったライブラリ。

管理をさらにシンプルに

コンサルタントごとの強みと弱みを把握して、意味のあるディスカッションとより的確な指示を。
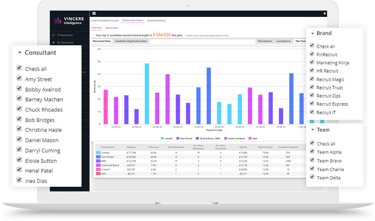
Intelligence Rebuilt Recruitment Dashboard 3
Intelligence Rebuilt Recruitment Dashboard 4

フィルター検索機能

ブランド、支店、チーム別…
フィルター機能を使って必要なデータをすばやく抽出。
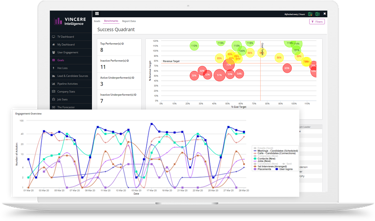
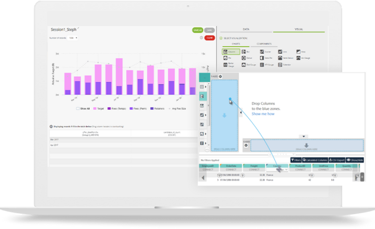
いま起きてることを、360度みわたせる

事業開発、パフォーマンストラッキング、パイプライン管理、手数料計算から売上予測…
Vincereインテリジェンスなら瞬時にアンサーをくれる。
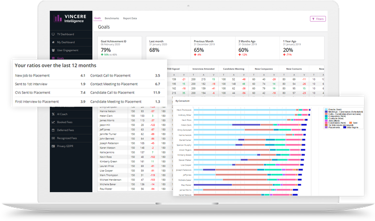


Product Intelligence Icon 1

ターゲットとKPIのモニタリング

チームの目標を設定したら、プラットフォーム上で活動状況、達成状況をトラッキング。
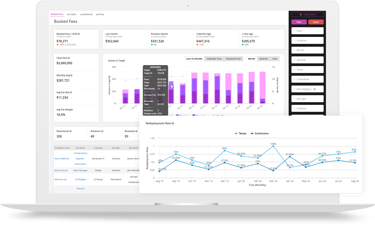
 

Product Intelligence Icon 2

収益と支出の動きを追跡

残業代、繰延額を含めた正確な収入の把握が
可能。


Product Intelligence Icon 3

広告掲載費用の節約

分析ツールで効率の良いソースを確認できるので、無駄な求人広告掲載に投資する必要はもうありません。

Product Intelligence Icon 4

トップクライアントを知る

最も売上につながる、有益な顧客を導き出す。


Product Intelligence Icon 5

ゲーミフィケーション

リアルタイムに売上ランキングを表示させて、
個人・チームのモチベーションアップ。

Product Intelligence Icon 6

全てのデータ品質を向上

不要なデータを省き、必要なものを掘り下げる。「ふるいにかけた」データをレポート化。

Product Intelligence Icon 7

CRMとATSの活用を促進

システムの使用率を把握し、投資効果を最大化。


Product Intelligence Icon 8

コンプライアンス監査へ対応

ダッシュボード上で全アクティビティの記録・トラッキングが可能。GDPR(EU一般データ保護規則)に対応。

カスタム可能な
分析・レポート

Vincereの分析モジュールならほしいレポートがすぐに見つかる。

詳細はこちら →

Product Intelligence Pre Built Recruitment Dashboard 4

ダッシュボードとリーダーボードがきちんと機能している為、あらゆる情報が「見える化」できます。
その為マネージャーだけでなくコンサルタントも自分が今どういう状況で、何をするべきかが即座にわかるようになっています。


Tempting Ventures - Rob

ロバート・クワーク 様
Tempting Ventures 社 マーケティング部長


ひとつのプラットホームで、
多くのビジネスを創り出す。

Recruitment OS?


Recruitment terms & glossary:

A recruitment or talent dashboard is a tool that provides interactive visualizations of your recruiting data. With one, users can quickly get an overview of the process, identify trends, and spot areas for improvement.

Recruitment metrics dashboards are typically used to track the number of applications received, the number of candidates interviewed, and the number of offers extended. Additionally, it also helps with monitoring overall progression by department and job function.

Thanks to the ability to visualize all relevant activities in one single place, these dashboards are extremely beneficial for staffing agencies that wish to optimize their recruitment process and success.

Dashboards are a critical asset to staffing agencies for a variety of reasons.

​Firstly, they provide an easy way to understand potential recruiting problems. Thanks to multipoint data tracking, it becomes simpler to identify bottlenecks and inefficiencies. Once this is done, it is easier for agencies to make necessary changes or improvements.

​Additionally, they allow staffing agencies to make better, data-driven decisions. This in turn helps them to use their resources more efficiently and effectively, to make informed choices about which potential candidates to pursue.

​These dashboards are also useful for managing team performance as they provide a visual background to evaluate if your recruitment team are meeting their KPIs.

​Finally, by analyzing recruiting funnels, staffing agencies can come up with refined strategies to continuously improve their chances of making successful placements.

Recruitment dashboards are a powerful data visualization and business analysis tool for recruiters. That said, designing an effective dashboard is not simply a matter of randomly stitching together a bunch of charts and graphs. To be truly useful, one needs to follow some best practices:

1. Be selective about data

Data included on the dashboard should be carefully chosen to provide users with the most useful and relevant information. Too much data can be overwhelming, while too little can leave key insights unnoticed.

2. Use charts and graphs

Charts and graphs should be used judiciously to visualize data in a way that is easy to understand. The navigation needs to be straightforward so that users can quickly find the information they need.

3. Remember to update continuously

Finally, data should be updated frequently to ensure that the dashboard always provides an accurate picture of the current situation.

A recruitment analytics dashboard is a powerful tool that can help streamline the recruitment process and provide valuable insights into your daily operations. But how do you build one that truly works?

The first step is to decide on the types of dashboards you need. Do you want a simple overview of your recruiting progress or something that has more detailed information? Do you want to track the number of applications you receive, or the number of interviews conducted, or the number of offers extended?

Once you have decided on the types of data you want to track, it is time to identify the relevant metrics. For example, if you are tracking the number of applications you receive, you will want to look at things like response and conversion rates. If you are tracking the number of interviews you conduct, you would want to look at things like interview-to-offer ratio and time-to-hire.

Post that, it is time to integrate all your data sources into one place. This step is very important as it allows recruiters to track their progress over time and spot trends that might otherwise be missed.

Finally, you can now compose your recruitment KPI dashboard in Excel/ Google Sheets or build it using recruitment agency software.

When it comes to recruitment dashboards, there are four main types: strategic, operational, analytical, and tactical:

1. Strategic dashboard

A strategic dashboard is focused on the big picture. It tracks KPIs such as time-to-hire and cost-per-hire that help senior management make decisions about the direction of the recruitment function.

2. Operational dashboard

An operational dashboard is focused on the day-to-day running of the recruitment team. It includes metrics such as vacancy rate and number of applications per role. Based on this data, recruiters can track their progress and identify any bottlenecks in the process.

3. Analytical dashboard

An analytical dashboard is focused on data analysis with metrics such as conversion rates and source-of-hire. This information enables recruiters to understand where candidates are coming from and how effective the current process is.

4. Tactical dashboard

A tactical dashboard is focused on short-term goals which are visualized with metrics such as open roles and requisitions in progress. Based on this, recruiters can prioritize their work and ensure that all vacancies are filled promptly.

One of the most important aspects of any recruitment process is having the ability to track and measure key metrics. This allows companies to see what is working well and what is not.

Some of the most important metrics to track in your recruitment metrics dashboard include:

  • Applicants per opening: The number of applications received for a job, divided by the number of openings.
  • Offer acceptance rate: The percentage of candidates who accept an offer.
  • Recruitment experience: How satisfied candidates are with their overall recruiting experience.
  • Time to hire: The amount of time it takes to fill a vacancy.
  • Quality of hire: This metric measures the value and quality of hire.
  • Cost per hire: The total cost of recruiting a new candidate.
  • Turnover rate: The percentage of candidates who leave during a given period.

Recruitment dashboard software is specifically designed for managing recruitment data. As a result, it typically includes features and tools that make it easy to track and analyze process-related information.

By contrast, Excel and Google Sheets are general-purpose tools created for generic purposes. While they can be used as a type of dashboard, they don't include features that make them as effective as dedicated software.

Another advantage of using software is that it's generally easier to use. This is because the interface is designed with users in mind, and the software is updated regularly.