Recruitment dashboard software at your fingertips
The winning formula for your business isn't buried in spreadsheets. It lies in Vincere's pre-built analytics and recruitment dashboard software.

Recognised by leaders, loved by 22,000+ recruiters


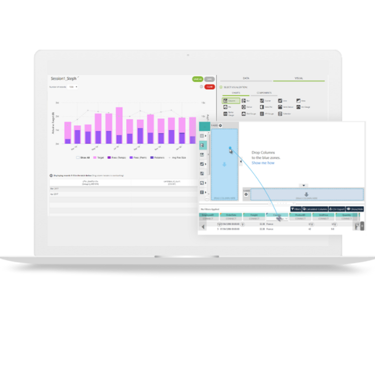
No Spreadsheets, No IT Required
Access a library of best-practice dashboards, including 50+ ready-made reports.
There’s no room to hide. You get excellent visibility right down to the consultant level, and we can do that because the dashboards and leader boards work so well.
Management Made Simple
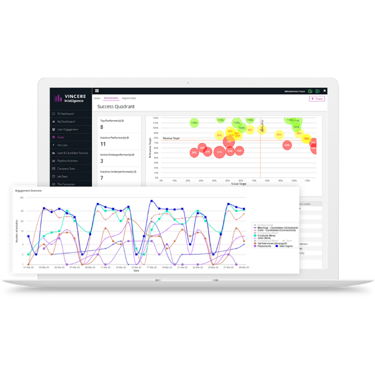
Uncover the strengths and weaknesses of each consultant, so you can have meaningful conversations to help them improve.
Slice & Dice in Real-time
Apply filters to see what you need quickly. Drill down by brands, offices, teams and individual consultants.
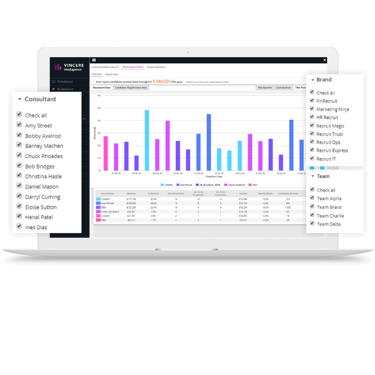
A 360° view across your entire business, in real-time.
From business development, performance tracking, pipeline activities, through to fees and forecasting, Vincere Intelligence delivers all the answers you need within seconds.
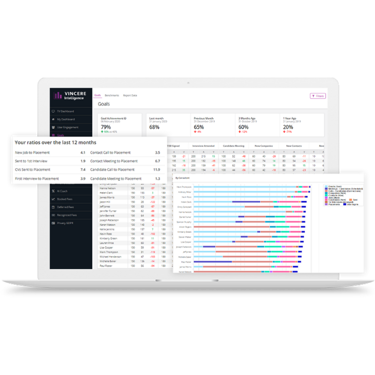
Monitor goals, targets & KPIs
Set targets and keep an eye on your team's performance by looking at their activities tracked in the platform.
Track revenue growth
Know exactly how much money is coming in, including booked, deferred & recognized fees over time.
Keep tabs on ad spend
Job boards are expensive. See which sources are bringing in the best candidates and the best ROI.
Know your top clients
Evaluate effort by company and how much business they've given you.
Gamify & broadcast wins
Tap into recruiter's competitive nature by displaying real-time stats and rankings on a leaderboard.
Improve overall data quality
Let Vincere do the policing for you with data reports for you to drill down and get rid of 'garbage'.
Drive CRM / ATS adoption
Maximise your investment by monitoring usage. If it's not in Vincere, it didn't happen.
Audit-ready compliance dashboards
All your GDPR activities logged, tracked and visualized on one dashboard.
Looking for custom reports?
Vincere's self-serve analytics module gives you the superpowers to build whatever reports you need.